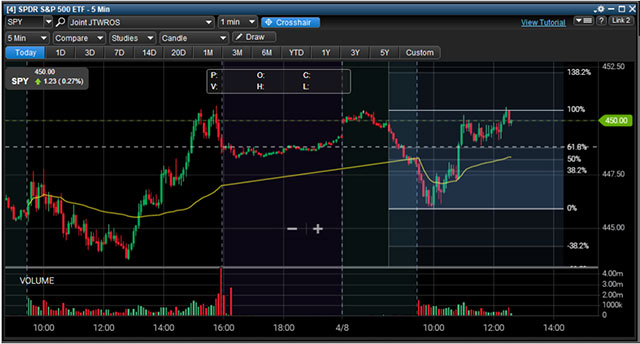
- At 7:42am SPY hit a high in the premarket of $450.47.
- At 8:01am SPY hit a high of $450.405. (Some brokerages begin at 8am causing a few minutes of price spikes).
- At 10:00am SPY hit the morning low of $445.94
You will only need to know the premarket high and morning low to create a Fibonacci Retracement day trade. For this trade subtract the morning low from the premarket high to calculate the range of a 100% Fibonacci Retracement move. $450.47 - $445.94 = $4.53.
Setting up Fibonacci Retracement Levels for a SPY Day Trade

Today we are going to analyze entry and exit points for a day trade on the SPY ETF.
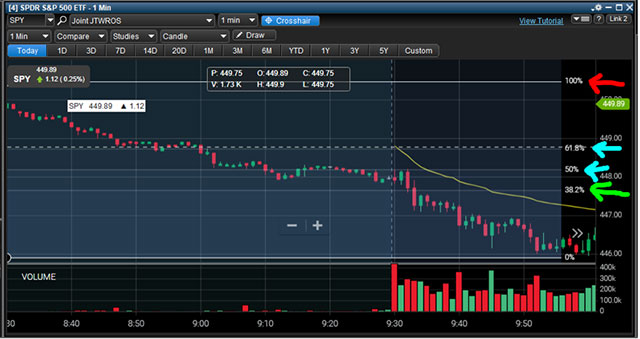
The first thing we do is mark the pre-market high as $450.47 as the top of the Fibonacci chart graph. The second thing we will do is map the bottom of the Fibonacci chart to the mornings low at 10am which was $445.94.
Setting Entry and Exit Price Targets Using Fibonacci for Day Trading SPY

So how do you make money trading the S&P 500 ETF called SPY? One way will be to play a bounce play using Fibonacci Retracement Levels.
In the chart above we identified the Entry Price Target of 38.2% Fibonacci with a risk tolerance of 50 cents. The goal would be to get in at the 38.2% Fibonacci chart level and hold the position as long as it doesn’t drop below 50 cents from the Fibonacci line.
Next we will setup 3 more price targets to pay ourselves. Price Target 1 will be the 50% Fibonacci retracement level. This is a good area to take some profit incase the bounce fails.
Price Target 2 for another payout will be at the 61.8% Fibonacci level. If the bounce is strong, it will surpass this level, otherwise this might be a possible failure point.
The final Price Target 3 we will set at the 100% Fibonacci level. This is where you would want to take out most of your position. You can leave a little on the table for a 138.2% Fibonacci retracement level.
The Purpose of this Day Trading Guide
The purpose of this day trading guide for the SPY is to give people who have access to their smartphone or computer during regular market hours to participate in day trading the S&P 500 ETF.
You will only need the pre-market highs and lows as well as the days morning low or high to plot out the Fibonacci Day Trade.
What Was SPY Daily Chart Doing on This Day?

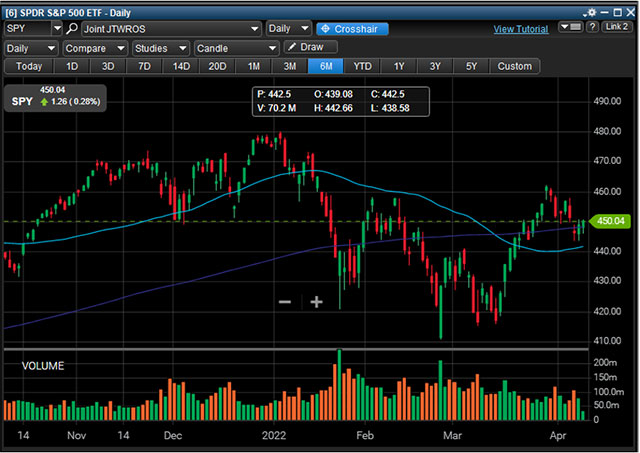
Today the SPY was holding above the 200 Day Moving Average. This chart indicates that SPY might be prepped for another leg upward.
You can also say that the SPY just peaked above the 200 day moving average and now will fail underneath it.
When the 200 day moving average and 50 day moving average cross due to continued straight in the SPY, this should be a indicative of more bullish SPY movements. However, do to ongoing uncertainty in the world, headlines and greatly affect the near future of the market.

